Desk-sharing ratios: how full UK offices really are
UK workspaces were about half used on an average day in 2026, so sharing desks makes sense. But set the ratio from the average and Tuesday runs out of desks. Here is how to set it from your peak.
 The DuoMe team ·

A desk-sharing ratio is the number of people per desk. At 1.5 to 1, 150 people share 100 desks.
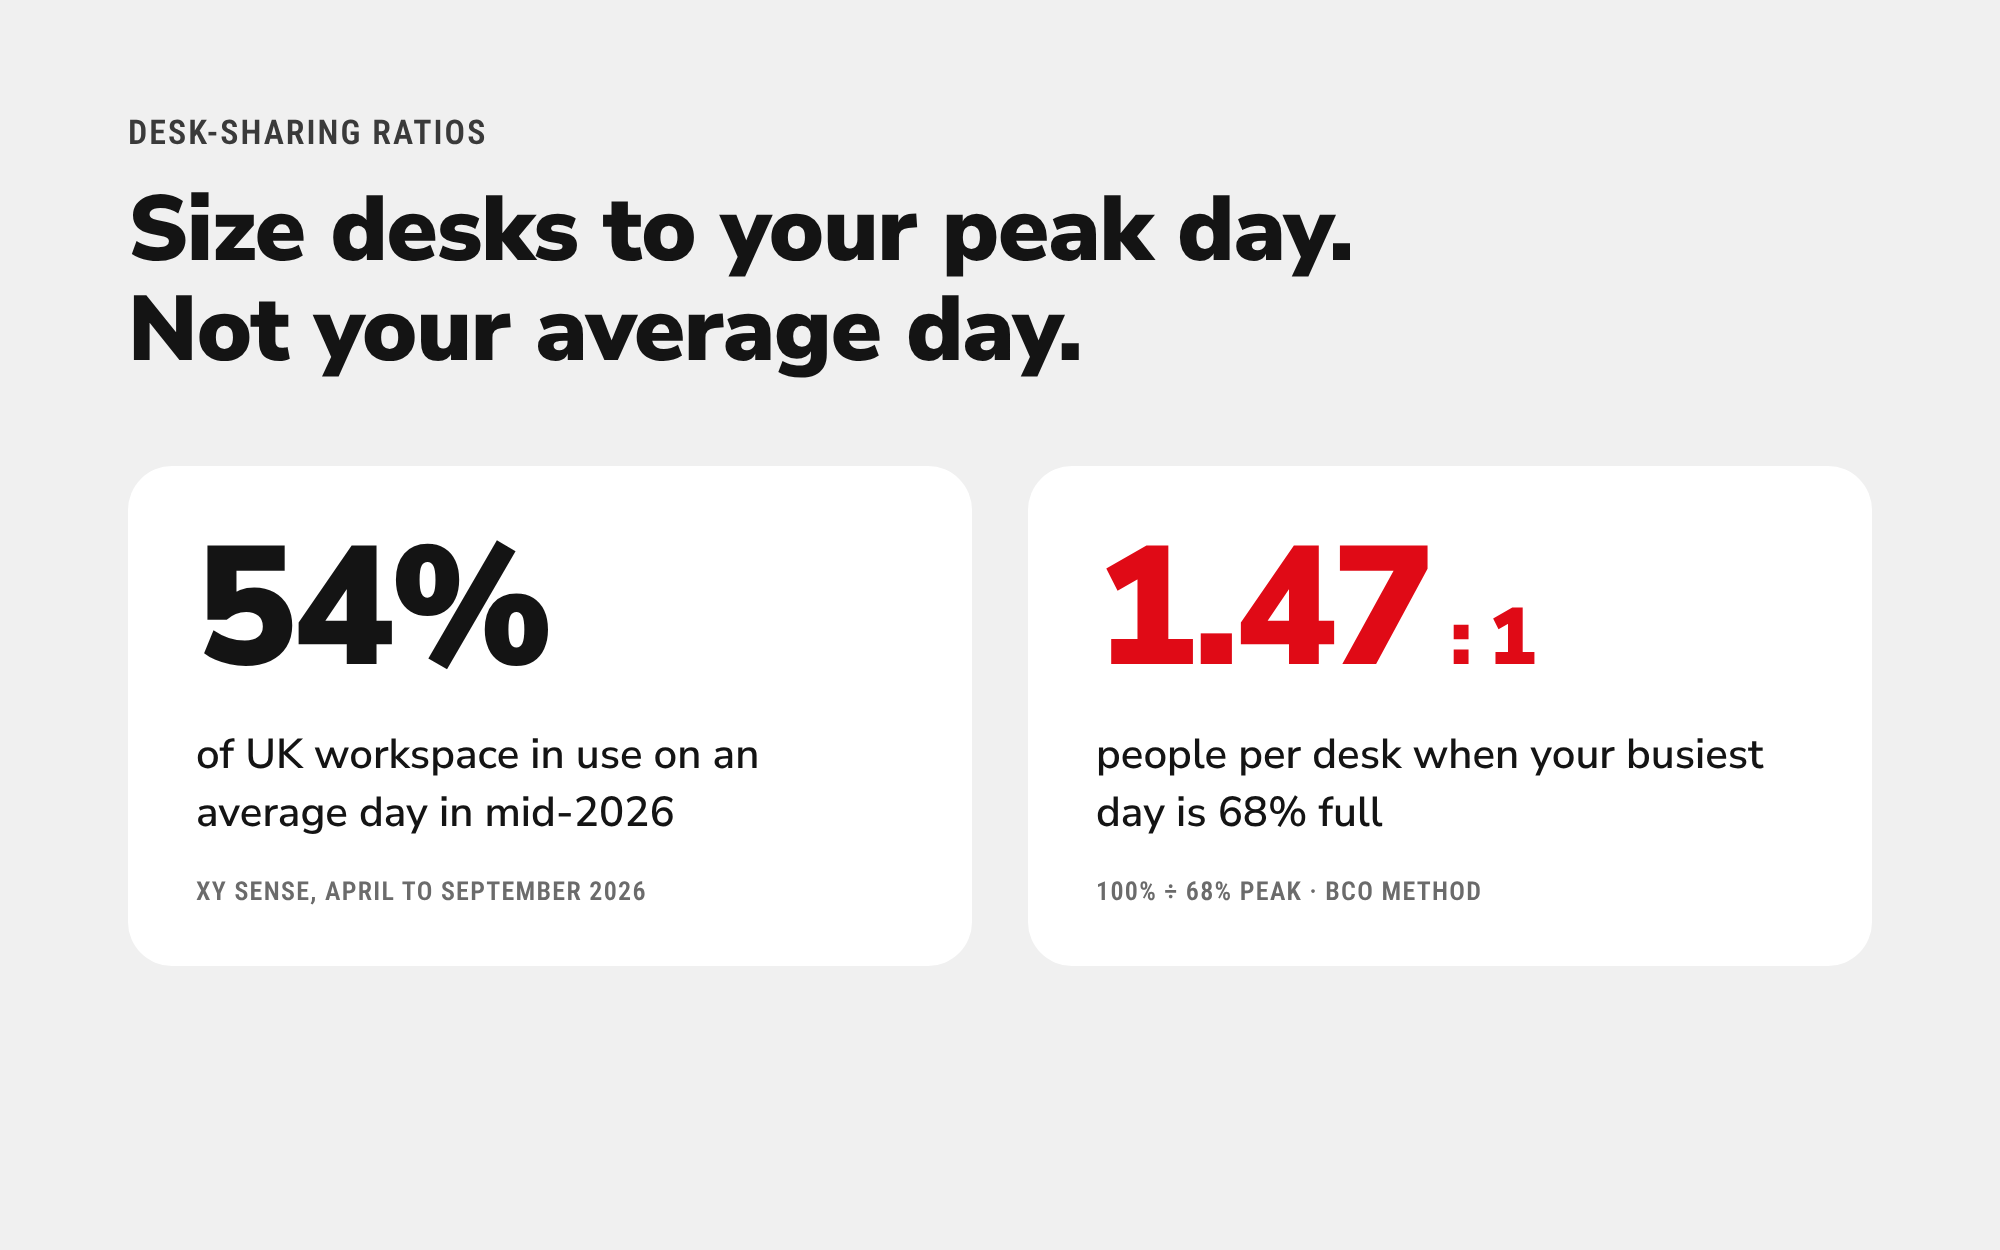
Most hybrid offices can share desks, because offices are far from full. Sensor data from XY Sense put average workspace utilisation in the UK at 54% from April to September 2026. Nearly half the space sat unused on an average day.
The catch is the busiest day. Set your ratio from the average and you run out of desks on Tuesday. Set it from your peak, and everyone who comes in has somewhere to sit.
How full UK offices really are
Offices are busier in 2026 than a year ago, but still far from full.
- UK office occupancy reached 44.1% in late January 2026, the highest Remit Consulting’s survey has recorded.
- UK workspace utilisation averaged 54% from April to September 2026 in XY Sense’s sensor data, against 46% across the eight countries it covers.
- Global building utilisation reached 53%, up from 38% in 2024, in CBRE’s 2026 Global Workplace and Occupancy Insights, based on data from its corporate clients’ portfolios.
The week is uneven. In XY Sense’s data for July to September 2026, utilisation ran at 55% on Tuesday, 54% on Wednesday and 52% on Thursday, but 43% on Monday and 35% on Friday. Peak days run well above the average: CBRE puts average peak utilisation at 80%, against its 53% average.
Buildings also differ widely. The most detailed UK study is the British Council for Offices’ 2025 review by workplace consultant Nigel Oseland, which drew on observation studies across 361 UK offices and swipe-card data from 155 buildings (BCO report). Average utilisation across all weekdays ranged from 13% in one building to 53% in another. A national figure can’t tell you how many desks your office needs.
For more of the data, see our round-up of UK hybrid working statistics.
How to work out a desk-sharing ratio
The BCO report gives two ways.
From your peak day. Divide 100% by the share of people in on your busiest day. If 68% of people are in at the peak, the ratio is 100 ÷ 68, or 1.47 to 1. For 125 people, that’s 85 desks.
From your average. Divide a target utilisation, such as 80%, by your average. At an average of 55%, that’s 80 ÷ 55, or 1.45 to 1, and 86 desks for 125 people.
We recommend the peak method. It sizes for the day that actually fills the office. The BCO also advises adding a few contingency desks when you use the peak, for visitors and busy weeks.
Count assigned desks separately. Anyone who needs the same desk every day takes it out of the shared pool, so work out the ratio for everyone else and add assigned desks on top.
Work out your own ratio
The calculator below, also on our office space calculator page, turns headcount and office days into the desks you need for a busy week. Divide your people by the desks it gives you, and that’s your ratio. The figures filled in are our example: 140 people today, growing 15% by move-in, coming in three days a week.
Desks for a busy week
110desksTypical busiest day: 99
161 people at move-in, about 62% in on the busiest day. 110 desks cover it in about 19 weeks out of 20. A typical week needs 99.
From headcount to desks
Space by use
Net internal area (NIA), the area UK rents are quoted on.
Meeting rooms
10 rooms
Desks at 1 to 5 office days
Same method for every bar. Your setting is in red.
In the example, 161 people need 110 desks for a busy week, a ratio of about 1.46 to 1. If you have measured your real busiest day, enter it under “Measured busiest day” and the calculator uses it in place of the model.
Typical ratios by office days
The ratio follows from how often people come in. Using the same method, 161 people need:
| Office days a week | Desks | People per desk |
|---|---|---|
| 1 | 42 | 3.8 |
| 2 | 77 | 2.1 |
| 3 | 110 | 1.5 |
| 4 | 141 | 1.1 |
| 5 | 148 | 1.1 |
Even at five days a week, the ratio is above 1 to 1, because someone is always on leave, off sick or out with a client.
These figures assume people choose their own days. Choice makes people cluster midweek, so the peak is higher than the average. In early November 2026, US badge data from Kastle showed a peak day of 65.3% against a weekly average of 56.4%, about 1.16 times. The calculator uses 1.17.
Ratios are getting more cautious
Desk sharing is normal now, but as offices fill up, companies are aiming for lower ratios. In CBRE’s 2026 report:
- 69% of clients said more than 40% of their people share desks.
- 48% target 1.01 to 1.49 people per seat, up from 21% in 2024.
- Only 33% target more than 1.5 to 1, down from 62% in 2024.
- None target one seat per person.
The lesson from busier offices is that a ratio set when attendance was low runs short when it rises. Base yours on a recent peak, and check it again as attendance changes.
The BCO has revised its planning assumption too. It now suggests planning around 66% mid-week utilisation for most organisations, down from the 80% it used before. That works out at an effective 15 m² per person, up from 12.5 m².
Raise your ratio safely
A higher ratio saves space only if people still find a desk. Four things make it work:
- Measure your peak. Use a few months of real attendance, not a survey of intentions. Booking data shows which days fill up and by how much.
- Lower the peak with team days. If teams have set days spread across the week, the busiest day comes down, and the same desks serve more people. Test it in the busiest-day planner.
- Let people book. At ratios above 1.5 to 1, people need to know they’ll have a desk before they travel. Desk booking on a floor plan shows what’s free and lets them sit near their team.
- Review it. Attendance changes with seasons, projects and policy. Check the peak every quarter and adjust.
If the ratio tells you that you have more space than you need, our guide to downsizing your office for hybrid working covers cutting it safely. For the full sizing method, from desks to square feet, see how much office space you need per person. If you’re moving, set the ratio before you choose a building: our guide on how to plan an office move puts it in order, and the move planner works it through with your numbers.
Frequently asked questions
What is a desk-sharing ratio?
The number of people per desk. At 1.5 to 1, 150 people share 100 desks. A ratio of 1 to 1 means everyone has a desk.
What is a good desk-sharing ratio?
It depends on how often people come in and how evenly they spread across the week. At three office days a week, about 1.4 to 1.5 people per desk is typical. In CBRE’s 2026 report, 48% of organisations target between 1.01 and 1.49 people per seat. Check yours against your busiest day, not your average.
How do you calculate a desk-sharing ratio?
Divide 100% by the share of people in on your busiest day. If 68% are in at the peak, the ratio is 1.47 to 1. Then add a few contingency desks, and count assigned desks separately.
Does the BCO recommend a desk-sharing ratio?
No single ratio. The BCO’s 2025 review explains how to calculate one from your own utilisation data, and suggests planning around 66% mid-week utilisation for most organisations, down from 80%.


